


Results 1 to 10 of 22
Hybrid View


-
20th Jan 2012, 07:59 AM#1


 OPMember
Ran the command from the tutorial you linked, and the results were:
Ran it again a few minutes later and it was all gone:Code:# netstat -atun | awk '{print $5}' | cut -d: -f1 | sed -e '/^$/d' |sort | uniq -c | sort -n 1 174.141.208.106 1 174.141.208.108 1 174.141.208.110 1 174.141.208.113 1 184.72.46.206 1 222.124.59.162 1 65.91.116.33 1 65.91.116.34 1 65.91.117.74 1 65.91.117.75 1 66.249.66.10 1 66.56.8.38 1 72.233.56.138 1 80.237.226.74 1 90.191.186.249 1 95.13.67.18 1 Address 1 and 2 174.141.208.102 2 174.141.208.107 2 174.141.208.109 2 174.141.208.111 2 174.141.208.112 2 174.141.208.98 2 184.72.46.156 2 184.72.46.160 2 199.59.149.166 2 89.151.116.53 3 174.141.208.100 3 174.141.208.101 3 174.141.208.103 3 174.141.208.96 3 174.141.208.97 3 98.151.190.165 4 174.141.208.99 4 199.59.149.31 4 41.237.211.167 9 0.0.0.0 14 86.75.10.55 32 127.0.0.1 44 69.31.50.114
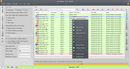
So I don't think it's a DDoS..I keep thinking it has to do with my configurations since its showing PHP-FPM as the CPU hog, but you brought up a good point regarding someone else using up resources so I'll send a support ticket regarding that.Code:# netstat -atun | awk '{print $5}' | cut -d: -f1 | sed -e '/^$/d' |sort | uniq -c | sort -n 1 123.125.71.28 1 161.69.220.1 1 222.124.59.162 1 41.237.211.167 1 63.232.227.10 1 67.170.253.61 1 69.31.50.114 1 85.100.150.63 1 89.248.174.73 1 Address 1 and 2 199.59.149.31 2 79.95.147.166 2 97.80.128.60 3 98.151.190.165 5 95.13.67.18 6 24.151.180.193 9 0.0.0.0 23 127.0.0.1
Thanks so far everyone who has replied. Any other ideas guys?LuDo8 Reviewed by LuDo8 on . High CPU Usage on VPS Hey guys, I get a lot of CPU spikes and I'm not quite sure how to fix it. http://i.lulzimg.com/2e85d176e2.jpg http://i.lulzimg.com/5b3174e9bc.jpg It constantly goes from very low 0-2% to 50-99% as you can see from the two screenshots. Its a 3GB 3 CPU Core VPS on Centos 5 64bit, Nginx, APC, and MySQL hosting about 2 wordpress sites with a combined daily traffic of about 6k UV/day. For the VPS specs I know for a fact that is plenty of power for just 6k traffic. And the port Rating: 5

 Register To Reply
Sponsored Links
Thread Information
Users Browsing this Thread
There are currently 1 users browsing this thread. (0 members and 1 guests)
Similar Threads
-
High CPU usage on my wordpress blog
By Zeokat in forum Server ManagementReplies: 14Last Post: 22nd Jun 2012, 07:37 AM -
[HELP] High memory usage on the server
By damnyou in forum Technical Help Desk SupportReplies: 9Last Post: 16th Mar 2012, 09:00 PM -
[Hiring] server Administrator, high cpu usage
By thesnake in forum Completed TransactionsReplies: 4Last Post: 17th Sep 2011, 04:55 PM -
[Wordpress, Shared Hosting] New Site, High Resource Usage...
By Rocke in forum Technical Help Desk SupportReplies: 3Last Post: 13th Dec 2010, 06:59 AM -
high memory usage help
By accyuklad in forum Hosting DiscussionReplies: 5Last Post: 6th Jul 2010, 04:45 PM


 Staff Online
themaManager - edit and manage...
Version 4.17 released. Open older version (or...